Dashboard Overview
Quick Answer: This article covers the first Dashboard Overview tab in the Dashboard section of GuestPoint. This section provides quick reference to how you are tracking in terms of Revenue & Occupancy. It is the most frequently used tab on our Dashboard.
Dashboard Overview Tab
The
Dashboard Overview tab gives you instant feedback on how your property is performing for the current month (or any historical month).
It uses Revenue & Occupancy metrics to track your property performance in a Month To Date context.
Refer to below illustrated screenshot detailing what each metric is referring to.
The Dashboard Overview tab contains three types of statistics:
- Revenue (Month To Date and Total Revenue)
- Average Occupancy Percentage (To Date),
- Average Revenue Metrics (Average Daily Revenue, Revenue per Available Room, and Average Daily Room Revenue Per Room Used).
Most of these statistics are calculated on a Month-To-Date basis where the statistics calculate from the First Day of the Month to Today's Date of the Month.
Total Revenue is the only statistic that calculates based on the entire month.
In addition to reporting the Current Month (or the historical month of concern), the Dashboard Overview tab provides two comparison dates offering the Total Revenue statistic of:
- The Previous Month's Total Revenue
- The Same Month from the Previous Year's Total Revenue

The top right-hand corner has a "Hide Tax" slider button that should be set to your preference.
If the Slider is Green (dot slided to right), this means Tax will not be included.
If the Slider is Green (dot slided to right), this means Tax will not be included.
If the Slider is Grey (dot slided to left), this means Tax is included.
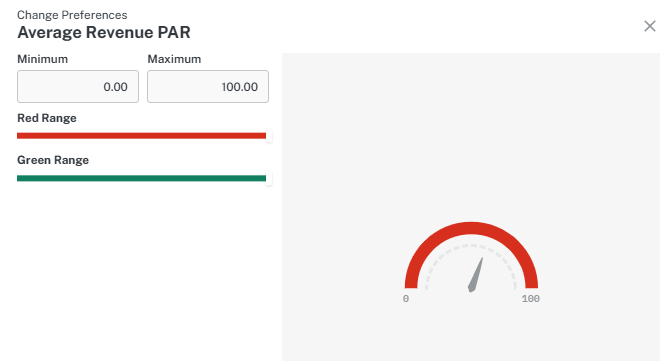
Change Preferences
Within the Average Metrics just underneath the half-circle dials, you will find a clickable "Change Preference" setting.
This setting affects the red and green areas on that metric.
Click into it and it will bring up below screen where you can set your minimum and maximum ranges.
Once saved, these ranges are then represented as a combined green or red range that allows you to visually track how you are progressing on that metric.
Related Articles
Occupancy
Occupancy Quick Answer: View occupancy data from Reports → Occupancy. Set date range and click Preview. The Occupancy Graph shows your Occupancy % between the Start Date and End Date selected. A great feature of this graph is that you can include two ...